Hyundai Bioland Logo
Sustainability Management
 Human Rights Management
Hyundai Department Store Group considers "ethics" a top priority in management. In line with this, Hyundai Bioland considers the human rights of the persons concerned as its top priority and carries out all tasks based on mutual respect and solicitude.
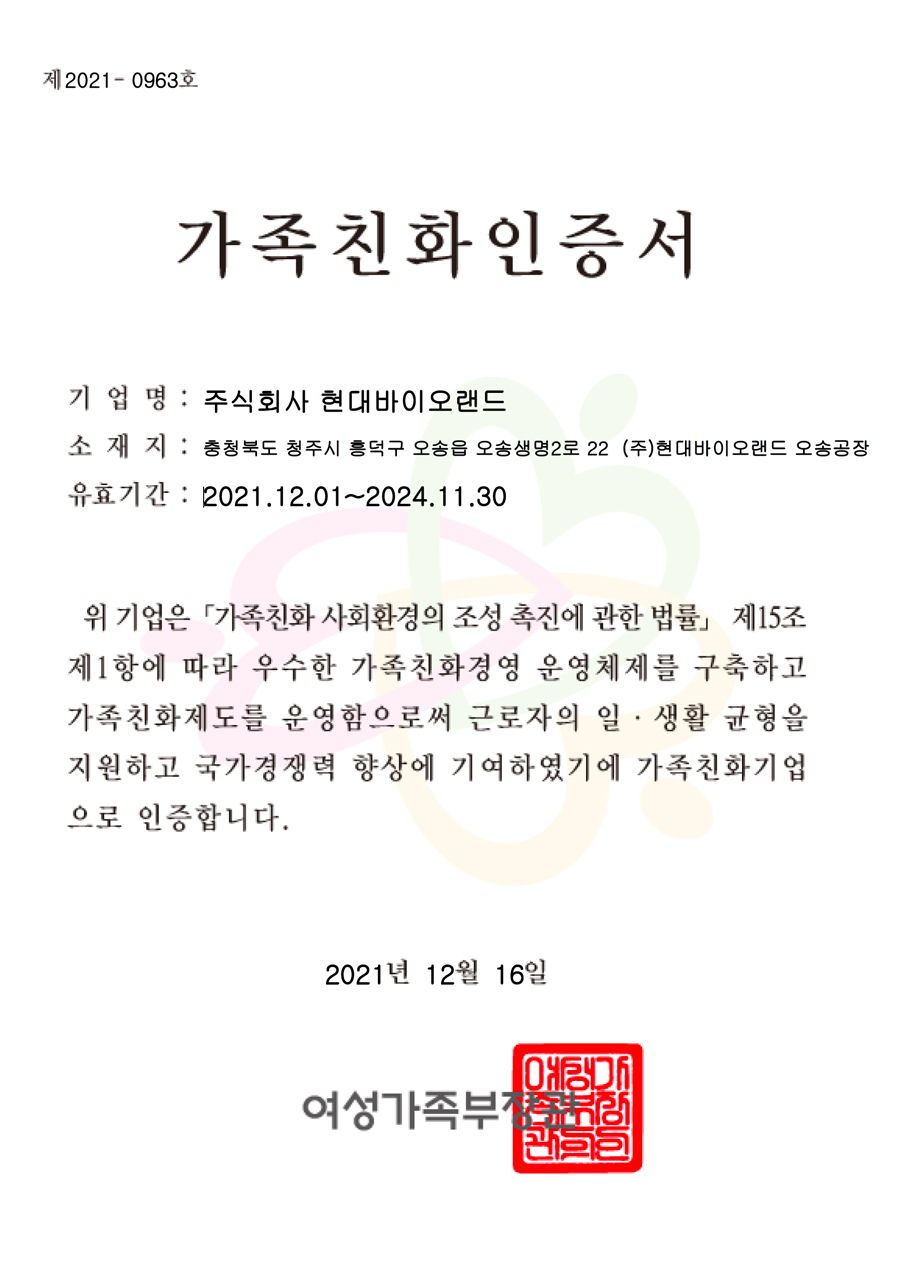
Family-friendly company certification
Our company makes an effort to be a family-friendly workplace through various work-family balancing programs. So it makes harmonized life balance work and family for members.

Hyundai Bioland’s Employee Diversity Indicator
| Category | Division | 2019 | 2020 | 2021 | Remarks | ||||
|---|---|---|---|---|---|---|---|---|---|
| Voluntary turnover rate | Sum | Person | 36 | - | 25 | - | 34 | - |
2019~2021 : Depends on the expiration of the contract period |
| Voluntary turnover |
Person, % | 35 | 97% | 23 | 92% | 34 | 100% | ||
| Manpower Status by Gender | Sum | Person | 301 | 100% | 307 | 100% | 327 | 100% | |
| Male | Person, % | 220 | 73.1% | 221 | 72.0% | 230 | 70.3% | ||
| Female | Person, % | 81 | 26.9% | 86 | 28.0% | 97 | 29.7% | ||
| Manager Status by Gender | Sum | Person | 106 | 100% | 126 | 100% | 118 | 100% | |
| Male | Person, % | 89 | 84% | 102 | 81% | 97 | 82.2% | ||
| Female | Person, % | 17 | 16% | 24 | 19% | 21 | 17.8% | ||
| Manpower Status by Age | Sum | Person | 301 | 100.0% | 305 | 100.0% | 326 | 100.0% | 2020 : 2 teenage employees 2021 : 1 teenage employees |
| 20’s | Person, % | 86 | 28.6% | 73 | 23.9% | 79 | 24.5% | ||
| 30’s | Person, % | 148 | 49.2% | 154 | 50.5% | 150 | 45.9% | ||
| 40’s | Person, % | 49 | 16.3% | 59 | 19.3% | 68 | 20.8% | ||
| 50’s | Person, % | 15 | 5.0% | 17 | 5.6% | 27 | 8.3% | ||
| Over 60 | Person, % | 3 | 1.0% | 2 | 0.7% | 2 | 0.6% | ||
| Manpower Status by Educational Background | Sum | Person | 301 | 100.0% | 307 | 100.0% | 327 | 100% | |
| Master or higher | Person, % | 61 | 20.3% | 65 | 21.2% | 76 | 23.2% | ||
| college graduates | Person, % | 138 | 45.8% | 140 | 45.6% | 156 | 47.7% | ||
| Junior college graduates or lower | Person, % | 102 | 33.9% | 102 | 33.2% | 95 | 29.1% | ||
| Manpower Status by Job Group | Sum | Person | 301 | 100.0% | 307 | 100.0% | 327 | 100.0% | |
| Marketing | Person, % | 46 | 15.3% | 46 | 15.0% | 49 | 15.0% | ||
| Production | Person, % | 162 | 53.8% | 156 | 50.8% | 149 | 45.6% | ||
| R&D | Person, % | 61 | 20.3% | 66 | 21.5% | 74 | 22.6% | ||
| Support | Person, % | 32 | 10.6% | 39 | 12.7% | 55 | 16.8% | ||
| Manpower Status by employment | Sum | Person | 301 | 100.0% | 307 | 100.0% | 327 | 100.0% | |
| Permanent | Person, % | 299 | 99.3% | 306 | 99.7% | 326 | 99.7% | ||
| Fixed-term | Person, % | 2 | 0.7% | 1 | 0.3% | 1 | 0.3% | ||
| Etc. | Person, % | 0 | 0% | 0 | 0% | 0 | 0% | ||
| Employment Status of Persons with Disabilities | Number of Persons with Disabilities | Person | 3 | 5 | 4 | ||||
| employment rate | % | 1.00% | 1.63% | 1.2% | |||||
| Parental Leave Status | Use of parental leave(Male) | Person | 0 | 0 | 2 | ||||
| Use of parental leave(Female) | Person | 5 | 3 | 8 | |||||
| Return rate(Male) | % | ||||||||
| Return rate(Female) | % | 100% | 67% | 67% | |||||
※ Total number of people : Last business day, based on the number of incumbents/leaves among direct employees
※ Note : Excluding outside directors, technical advisors, and Chinese subsidiaries such as current employees