Hyundai Bioland Logo
Sustainability Management
 Environmental Management
As the leader in the domestic business areas of cosmetics, medical devices, and food, Hyundai Bioland makes
environmental safety its top management task; it has selected a list of environmental safety goals with the
intention of creating a safe, sustainable society by promoting a leading environmental safety management system.
environmental safety its top management task; it has selected a list of environmental safety goals with the
intention of creating a safe, sustainable society by promoting a leading environmental safety management system.
Chemical Management Process
Through our internal rules based on legal standards, we systematically manage chemicals from inspection before stocking to disposal
after completion of use and operate a chemical monitoring system to prevent accidents caused by chemical leak.
after completion of use and operate a chemical monitoring system to prevent accidents caused by chemical leak.
| Before stocking | Compliance with the Chemical Substances Control Act and advanced monitoring of risk factors prior to stocking |
|---|---|
| Storage | Chemicals delivered to business sites are stored in safety facilities classified by risk level |
| Use | Go on duty after confirming the wearing of proper protection and safety gears according to risk levels when using substances |
| Delivery | Products manufactured at business sites are transported according to related laws, including the Act on the Safety Control of Hazardous Substances |
| Disposal | By-products and waste generated from manufacture are disposed of in a lawful manner according to the in-house waste management process |

Current Status of Use of Hazardous Chemicals
| Plant | Unit | 2019 | 2020 | 2021 | |||
|---|---|---|---|---|---|---|---|
| Plan | Performance | Plan | Performance | Plan | Performance | ||
| Osong | Ton | 166.52 | 126.35 | 158.19 | 90.21 | 150.28 | 33.98 |
| Ton/Product-Ton | 0.033 | 0.025 | 0.031 | 0.031 | 0.029 | 0.009 | |
| Ochang | Ton | 1.320 | 1.003 | 1.254 | 0.002 | 1.191 | 0.06 |
| Ton/Product-Ton | 0.0081 | 0.0062 | 0.0077 | 0.00002 | 0.0073 | 0.000001073 | |
| Ansan | Ton | 15.42 | 11.88 | 12.38 | 9.43 | 6.18 | 10.68 |
| Ton/Product-Ton | 0.017 | 0.013 | 0.016 | 0.012 | 0.015 | 0.026 | |
| Cheonan/Bundang | Ton | 0.001471 | 0.000981 | - | - | - | - |
| Ton/Product-Ton | 0.00003 | 0.00002 | - | - | - | - | |
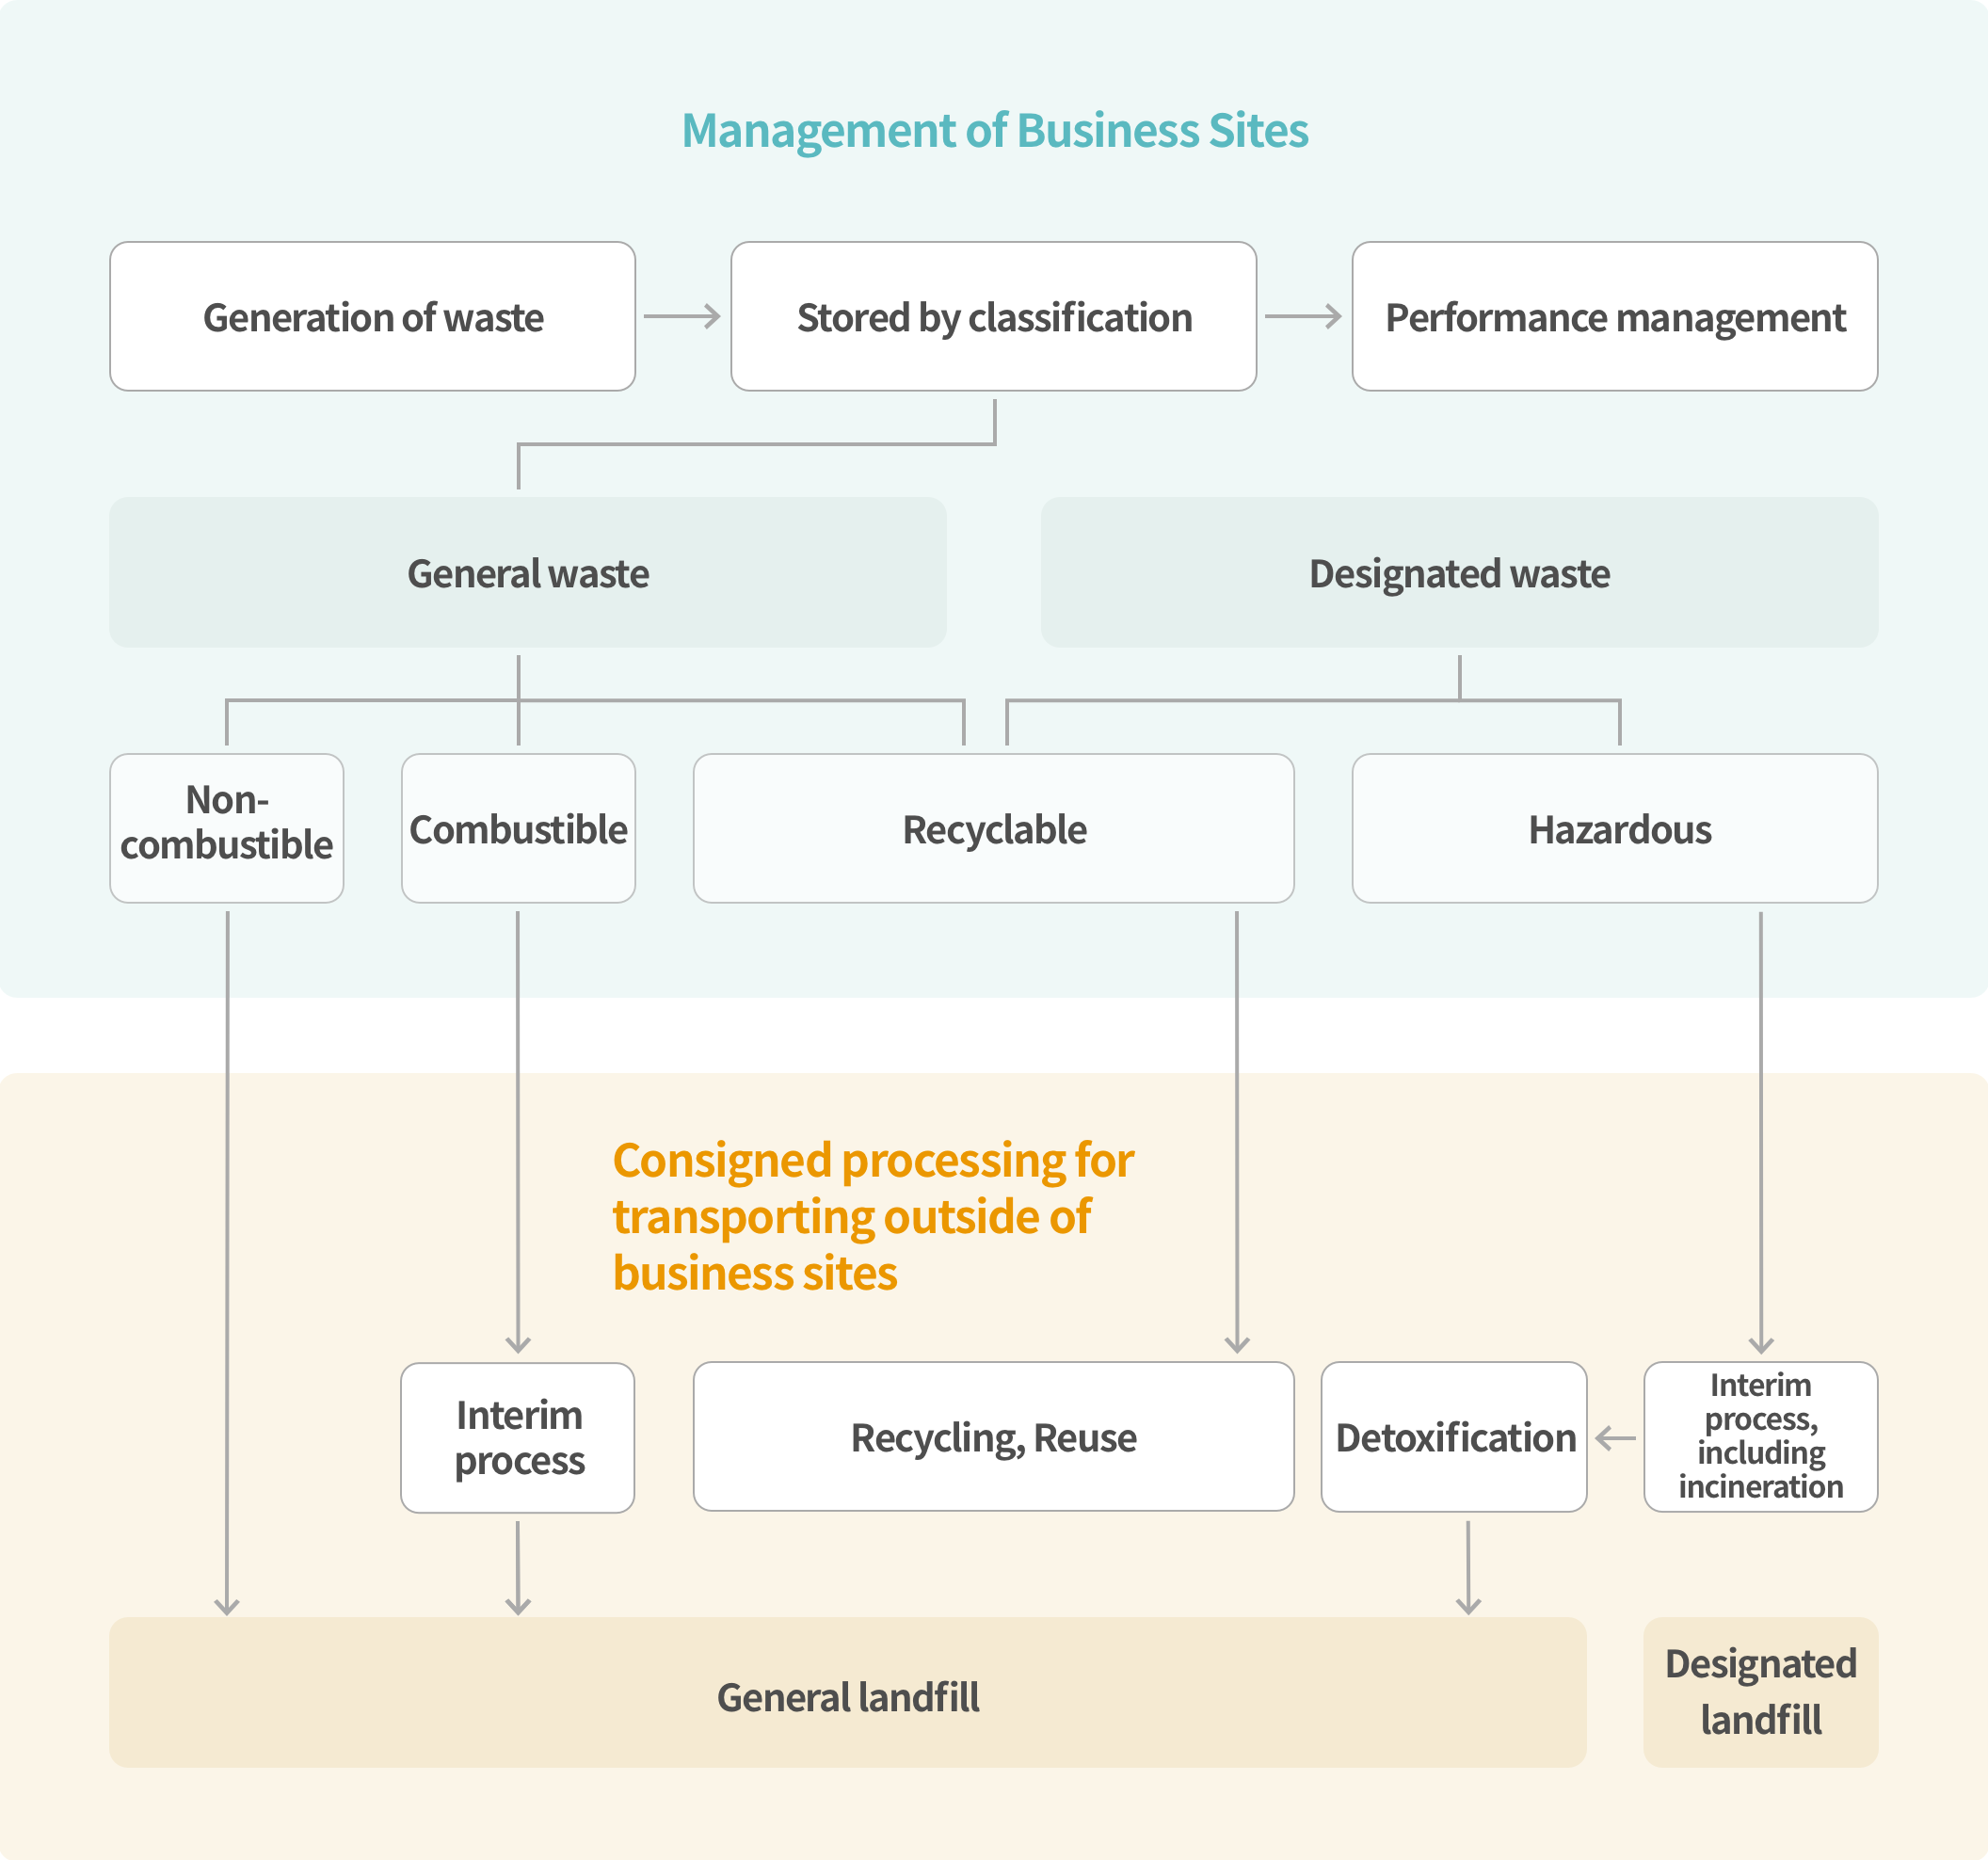
Waste Treatment Process
Hyundai Bioland minimizes environmental impact by legally managing waste generated from all processes (generation→transportation→treatment) of business sites and through activities for reducing waste disposal.
Current Status of Waste Disposal
· Current Status of Waste Disposal (as of 2021)
| Osong | Ansan | Ochang | Cheonan/Bundang | Total | |||||||
|---|---|---|---|---|---|---|---|---|---|---|---|
| Plan | Performance | Plan | Performance | Plan | Performance | Plan | Performance | Plan | Performance | ||
| Designated waste |
Recycling | 939 | 914 | 216 | 433 | 115 | 304.7 | 0 | 0 | 1,270 | 1,651.7 |
| Incineration | 0 | 0 | 147 | 0 | 1 | 1.5 | 0 | 0 | 148 | 1.5 | |
| Landfill | 0 | 0 | 0 | 2 | 0 | 0 | 0 | 0 | 0 | 2 | |
| Others | 0 | 0 | 0 | 0 | 0 | 0 | 0 | 0 | 0 | 0 | |
| Total amount |
939 | 914 | 363 | 435 | 116 | 306.2 | 0 | 0 | 1,418 | 1,655.2 | |
| General waste | Recycling | 1,109 | 818 | 626 | 1,374 | 44 | 83.9 | 120 | 114 | 1,899 | 2,389.9 |
| Incineration | 0 | 0 | 28 | 64 | 0 | 0 | 0 | 0 | 28 | 64 | |
| Landfill | 39 | 38 | 0 | 0 | 0 | 0 | 0 | 0 | 39 | 38 | |
| Others | 0 | 0 | 0 | 0 | 0 | 0 | 0 | 0 | 0 | 0 | |
| Total amount |
1,148 | 856 | 654 | 1,438 | 44 | 83.9 | 120 | 114 | 1,966 | 2,491.9 | |
· waste generation
| Plant | Unit | 2019 | 2020 | 2021 | |||
|---|---|---|---|---|---|---|---|
| Plan | Performance | Plan | Performance | Plan | Performance | ||
| Osong | Ton | 1,968 | 1,514 | 1,088 | 1,667 | 1,294 | 1,771 |
| kg/Product-Ton | 390.05 | 300.04 | 370.55 | 567.59 | 352.02 | 481.77 | |
| Ochang | Ton | 472 | 363 | 275 | 285 | 146 | 390 |
| kg/Product-Ton | 2,895 | 2,226.99 | 2,750 | 2,850 | 2,613 | 6,964.29 | |
| Ansan | Ton | 4,338 | 3,337 | 3,517 | 1,912 | 1,779 | 1,873 |
| kg/Product-Ton | 4,783 | 3,679.16 | 4,544 | 2,470.28 | 4,317 | 4,546.12 | |
| Cheonan/Bundang | Ton | 263 | 235 | - | 17 | - | 114 |
| kg/Product-Ton | 5.36 | 4.12 | - | - | - | - | |